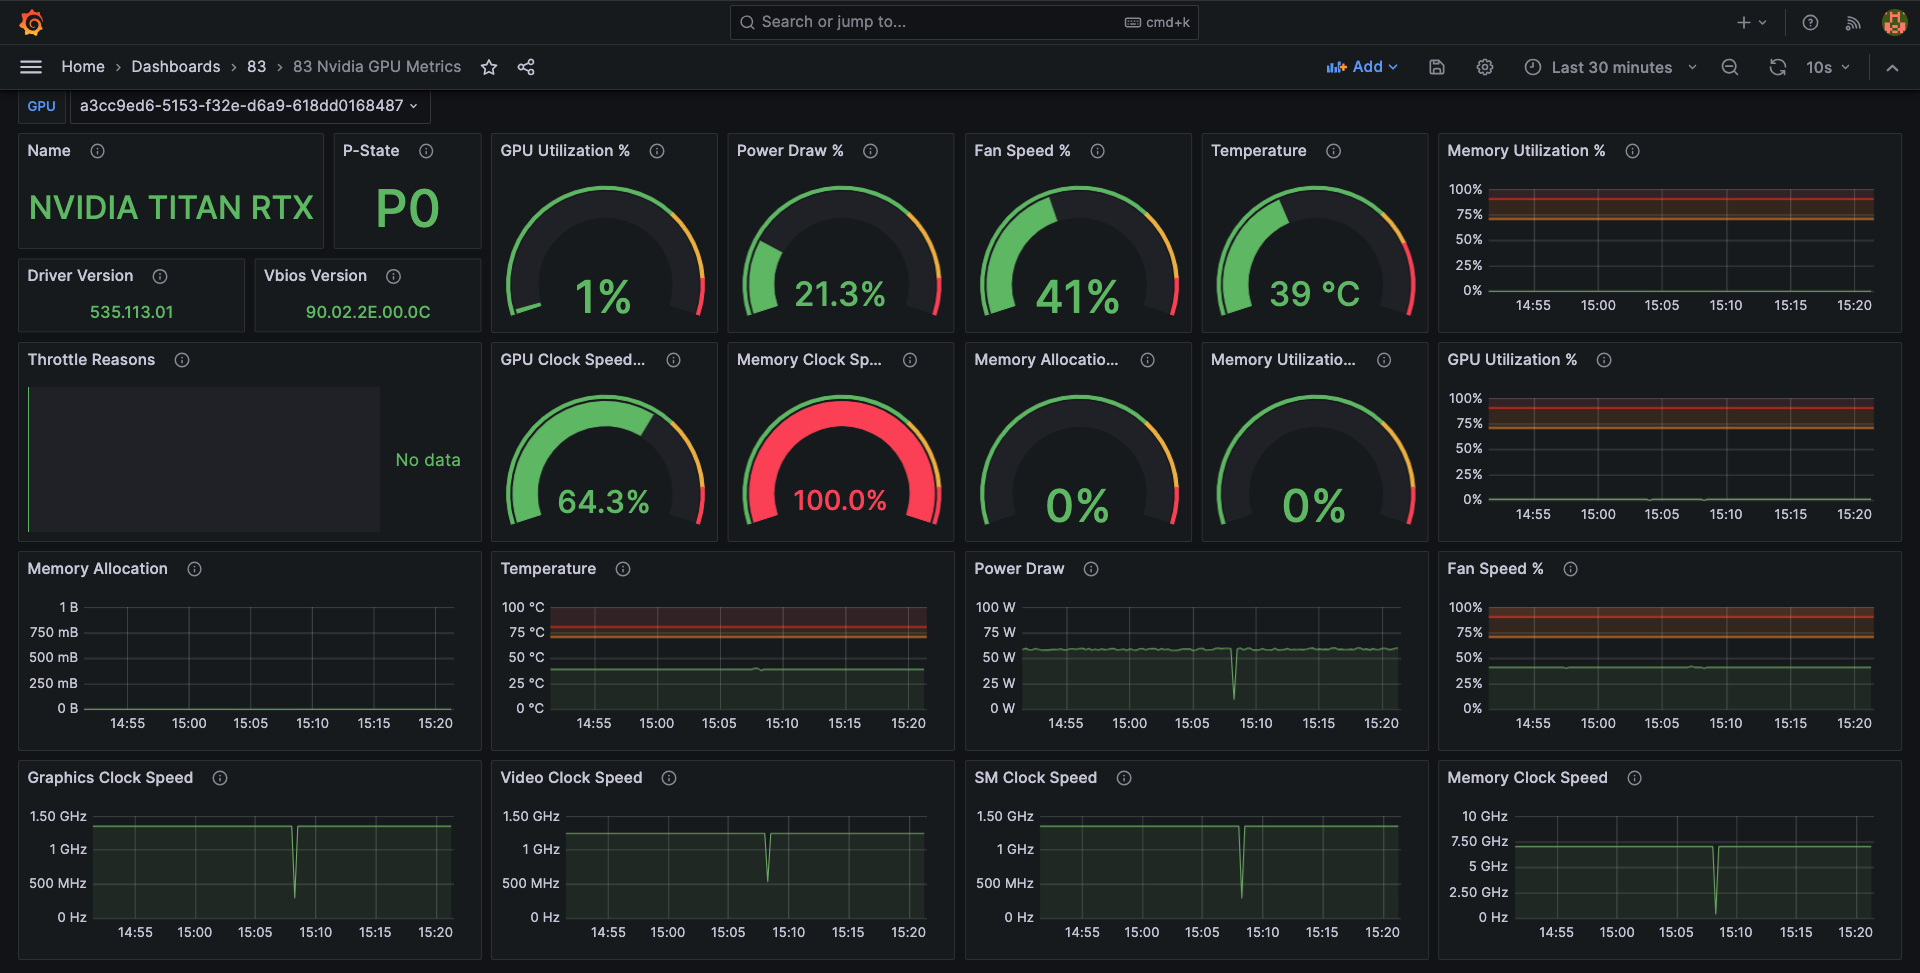
結果
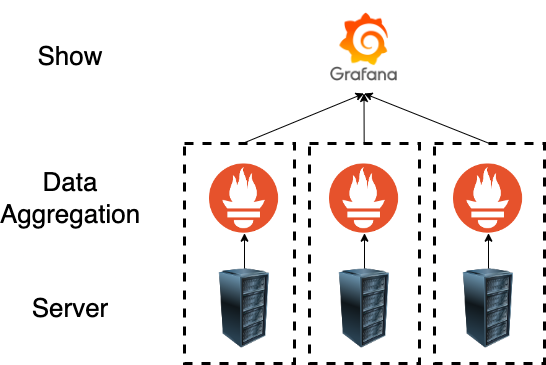
架構
建置步驟
下載需要的檔案,並啟動
|
|
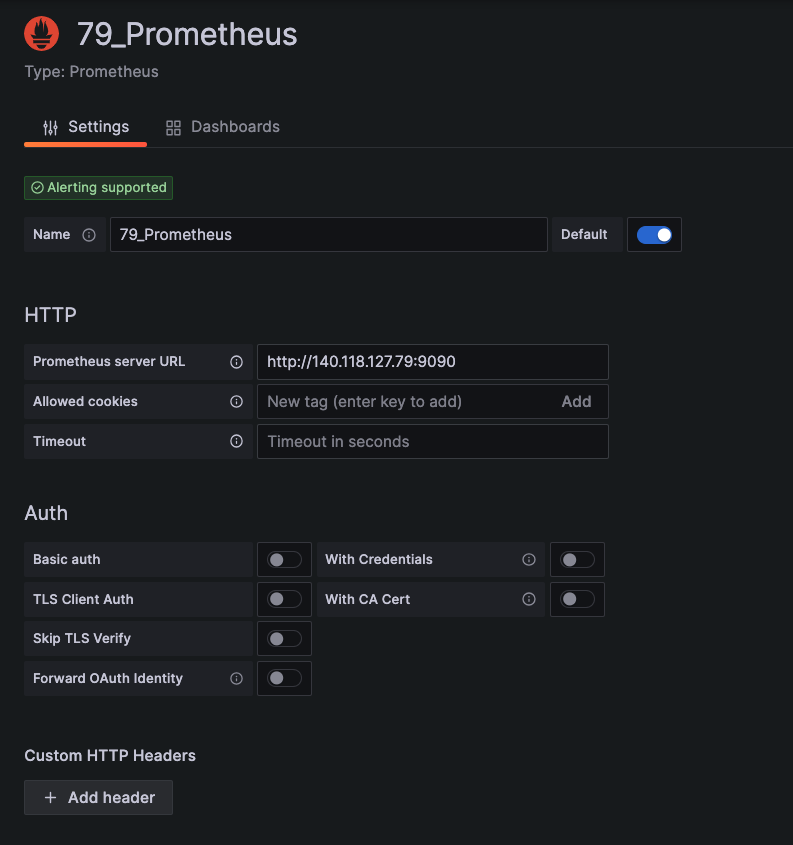
建立DataScoure
- meau->Connections->Data sources->Add new data source->prometheus
- 在Prometheus server URL,輸入<你的url>:9090
- Save & test
- 若有多台主機要重複此步驟,並且每台主機都要經過第一步驟。
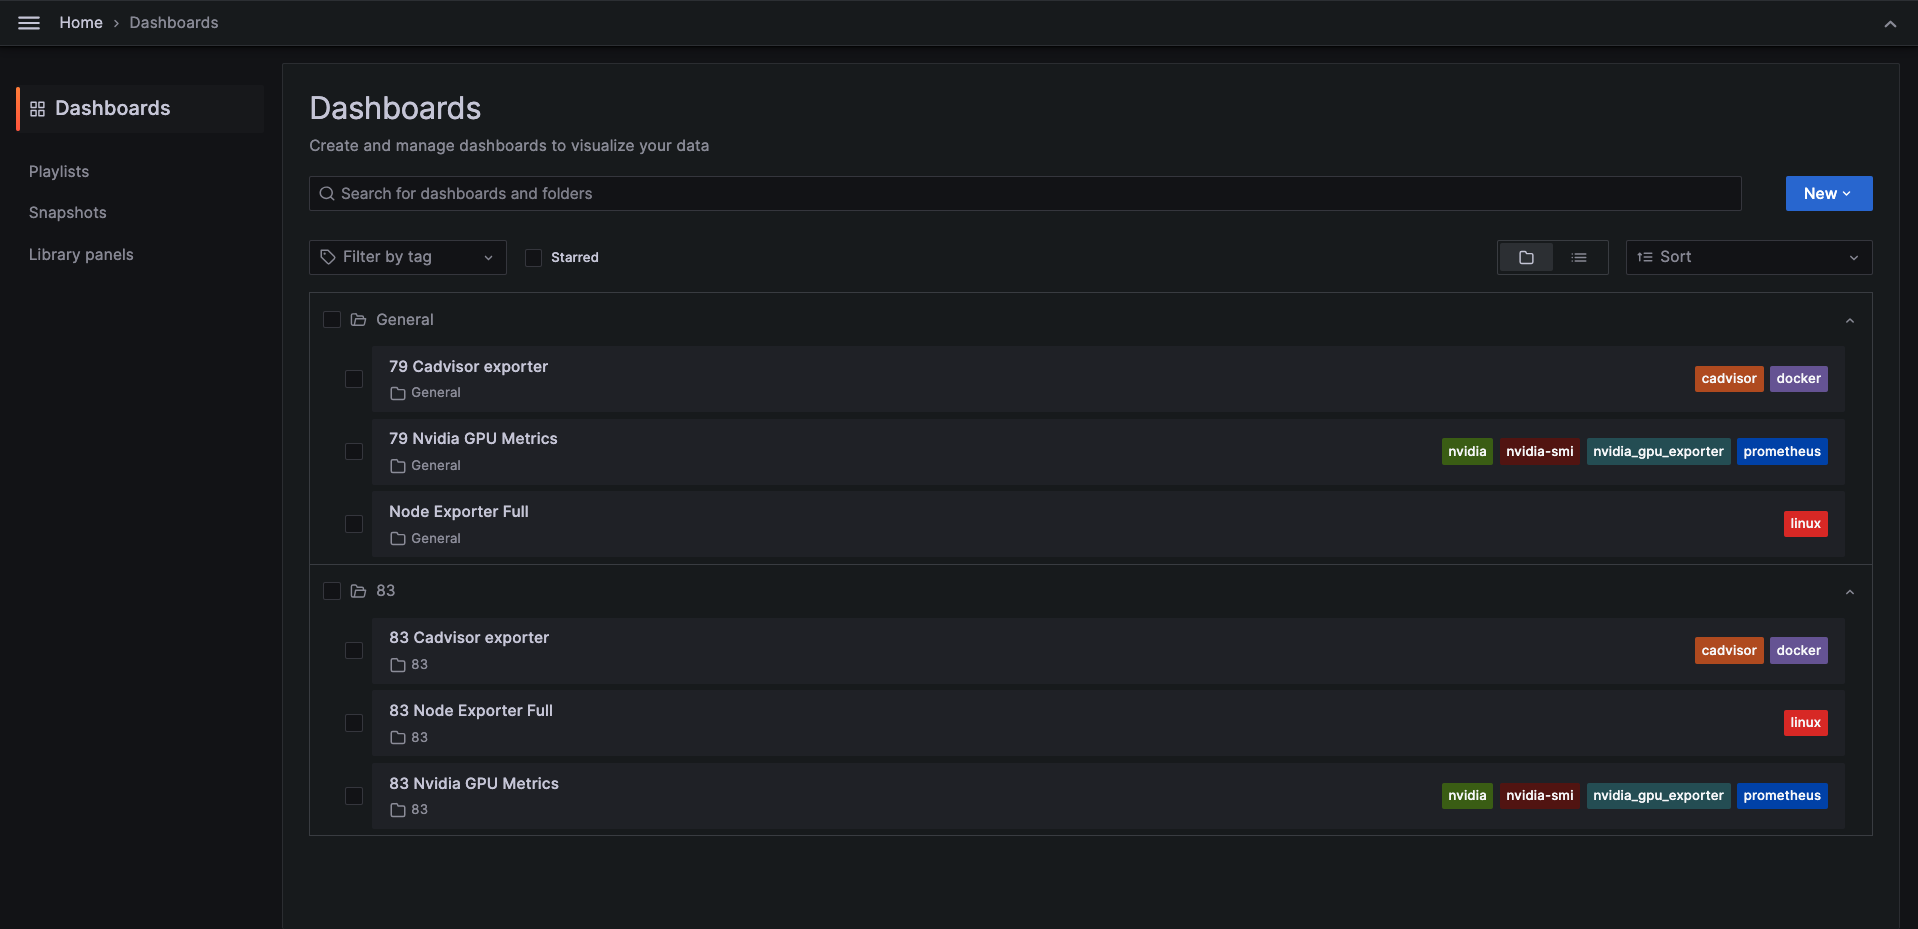
建立Dashboard
- 可依照喜好和使用的模組到https://grafana.com/grafana/dashboards/選擇喜歡的dashboards
- 本教學使用三個模組分別為node_exporter、cadvisor、nvidia_gpu_exporter
- node_exporter蒐集server基本資源,Ex:CPU、Memory、Network。參考模板:https://grafana.com/grafana/dashboards/1860-node-exporter-full/
- cadvisor 蒐集 docker容器內資源用量。參考模板:https://grafana.com/grafana/dashboards/14282-cadvisor-exporter/
- nvidia_gpu_exporter蒐集server GPU使用量。參考模板:https://grafana.com/grafana/dashboards/14574-nvidia-gpu-metrics/
- 進入模板頁面copy dashboard ID
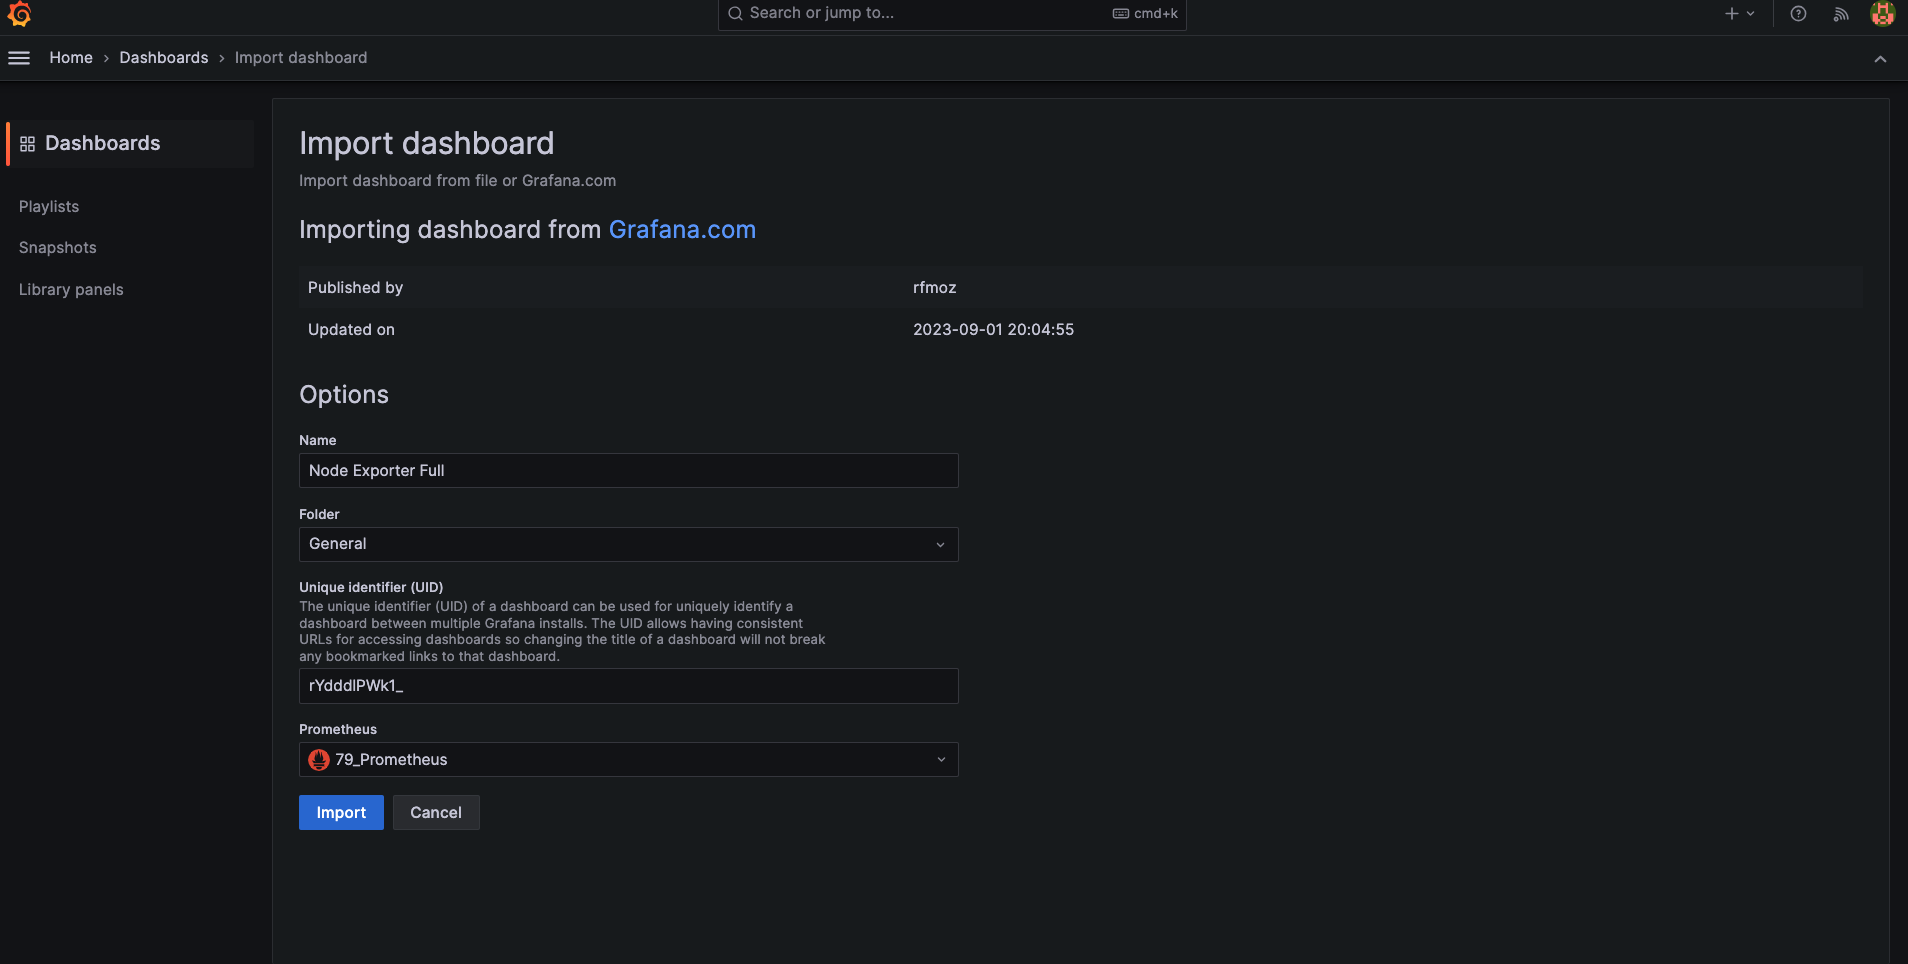
- Meau->Dashboards->New->Import
- 將ID 放入UID中,點選Load(Load之後會顯示另外一個ID)
- Prometheus(DataScoure)選擇資料來源
- 點擊Import
依照步驟2完成所有監控設定